
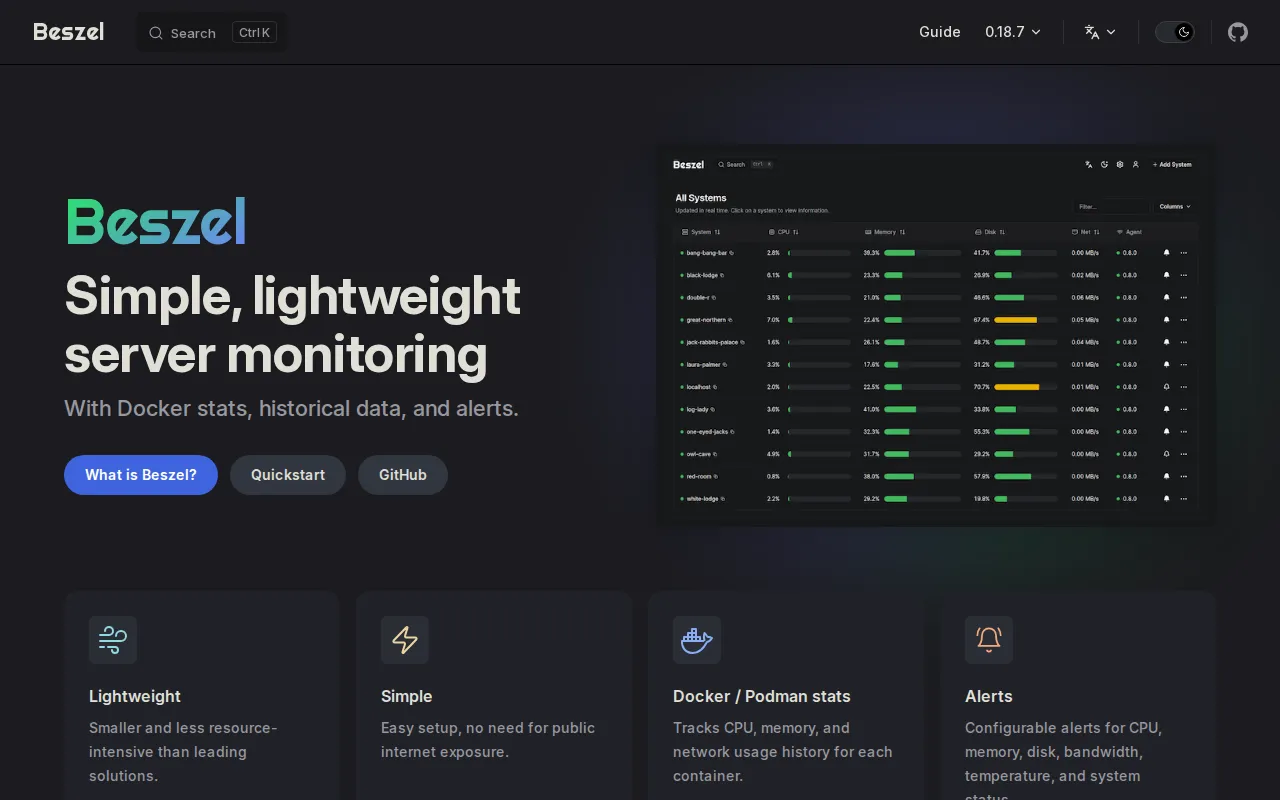
Beszel is a lightweight server and Docker monitoring stack: a central Hub dashboard plus small Agents on each host. You get real-time and historical graphs for system and container metrics without running a full Prometheus/Grafana farm—ideal for homelabs and small fleets.
Key Features
- System Metrics: CPU load, memory, disk, network bandwidth.
- Docker Awareness: Per-container CPU, memory, and network when the agent sees the socket.
- Multi-Server: One hub, many agents authenticated with public keys.
- Alerts: Threshold-based notifications (email, webhooks, and more depending on setup).
- Low Footprint: Agents often use only tens of MB of RAM.
- Simple Deploy: Docker images for hub and agent; Dokploy/Coolify friendly.
Why Choose Beszel?
- Datadog/New Relic pricing doesn’t make sense for a home server.
- Prometheus + Grafana is powerful but heavy for a few boxes.
- You care about disk filling up and containers thrashing, not only “is HTTP 200?”
- Use with Uptime Kuma: Beszel = inside the box, Kuma = outside availability.
Docker Deployment
Hub (dashboard):
services:
  beszel:
    image: henrygd/beszel:latest
    container_name: beszel
    restart: unless-stopped
    ports:
      - "8090:8090"
    volumes:
      - beszel-data:/beszel_data
    environment:
      - APP_URL=https://monitor.yourdomain.com

volumes:
  beszel-data:
Agent (on each monitored host)—copy the compose snippet from the Hub “Add System” UI (includes your unique KEY):
services:
  beszel-agent:
    image: henrygd/beszel-agent
    container_name: beszel-agent
    restart: unless-stopped
    network_mode: host
    volumes:
      - /var/run/docker.sock:/var/run/docker.sock:ro
    environment:
      PORT: 45876
      KEY: 'ssh-ed25519 AAAA...'
Getting Started
- Deploy the Hub and set
APP_URLfor correct alert links. - Create the admin account in the web UI.
- Add a system and deploy the agent with the generated key.
- Confirm metrics turn green and graphs populate.
- Set alert thresholds (e.g. disk over 85%, host down).
Full Setup Guide
Complete Dokploy walkthrough with Uptime Kuma: Beszel & Uptime Kuma Setup on Dokploy. Broader monitoring context: Server Monitoring Tools.